Written by Sunny Yoon
I'm going to investigate polar equations varying different variables.
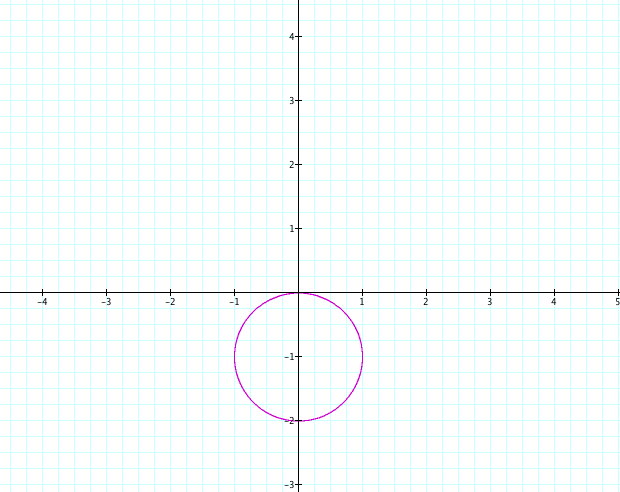
First, I'm going to vary a and k in this equation ![]() where a = 1 and k = 1.
where a = 1 and k = 1.
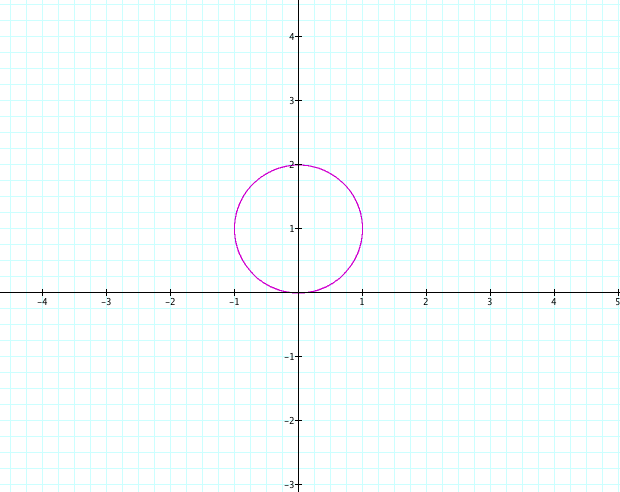
It is a circle with the center (0, 1) and radius = 1.
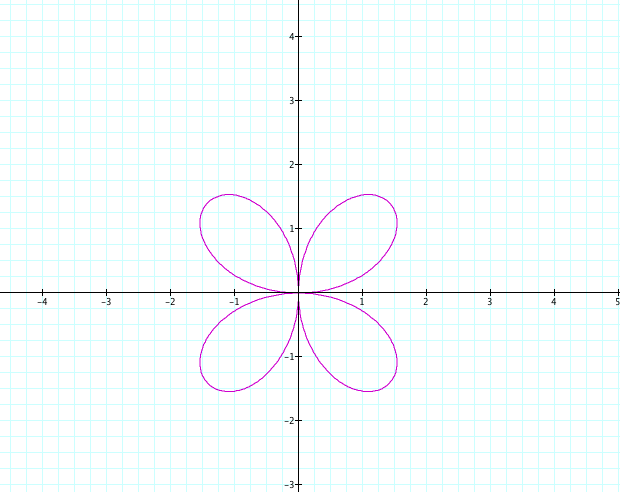
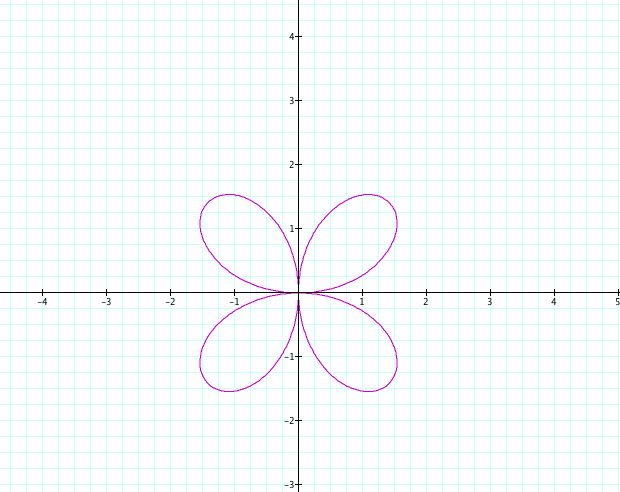
Now, let's vary k from -5 to 5.
What a pretty picture!
When |k| < 0.5, then the graph looks like a spiral that's spiraling out from the origin. Once |k| > 0.5, the graph "closed" in.
 |
 |
 |
 |
 |
|
 |
 |
|
 |
 |
|
 |
 |
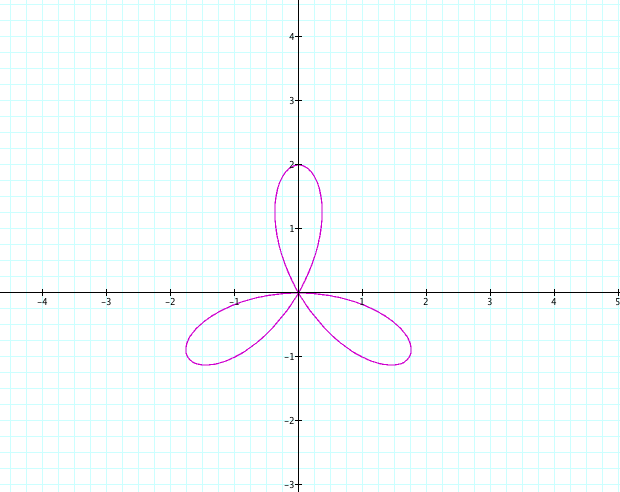
When |k| is an even number, the direction of the graph doesn't change. In fact, it's a same shape. However, when |k| is an odd number, the graph looks like they are rotated. |
Now what if you vary a? I'm going replace n in place of a and let n goes from -5 to 5.
The shape of the graph stays the same as a circle. It just expands on the positive y-axis or the negative y-axis depending on the sign of a and as |a| increases, the circle gets bigger too.
Now let's investigate when we replace sin with cos.
![]() where a = k = 1.
where a = k = 1.
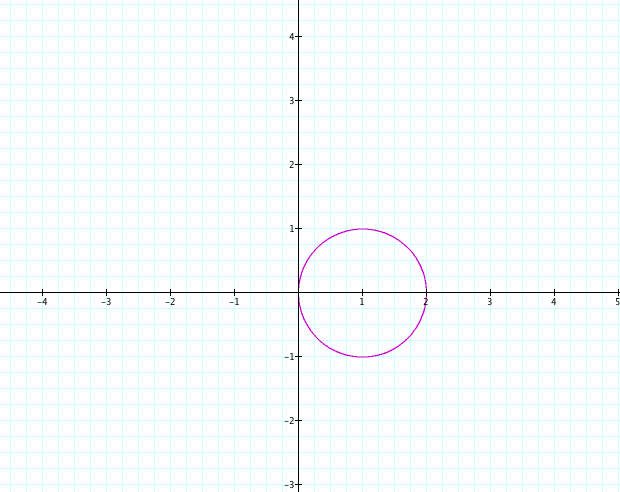
It appears to be a circle where the center is (1, 0) and the radius = 1. The only different is the center of a circle when you replace sin with cos.
Now let's vary k. k goes from -5 to 5.
When n= 0, the graph changes to a circle where the center is (0, 0) and the radius = 2. When |n| < 1, then the graph looks like a "pig's tail" as it's spiraling out and then twists once.
When |n| >1, then it looks very similar to ![]() where you vary the k.
where you vary the k.
 |
 |
|
 |
 |
|
 |
 |
|
 |
 |
The sign of k didn't affect the graphs. |
Here's a graph when you vary k from 5 to 15.
Let's vary a from -5 to 5.
Just like ![]() , the graph stays the same as a circle. However, the difference is that as a > 0, the circle expands on the positive x-axis while when a < 0, the circle expands on the negative x-axis.
, the graph stays the same as a circle. However, the difference is that as a > 0, the circle expands on the positive x-axis while when a < 0, the circle expands on the negative x-axis.
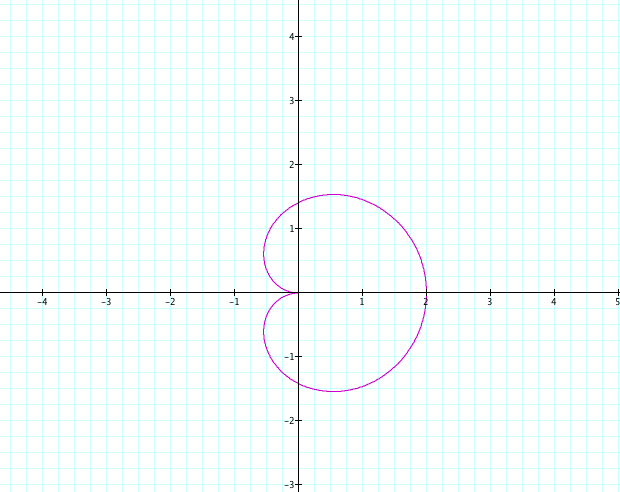
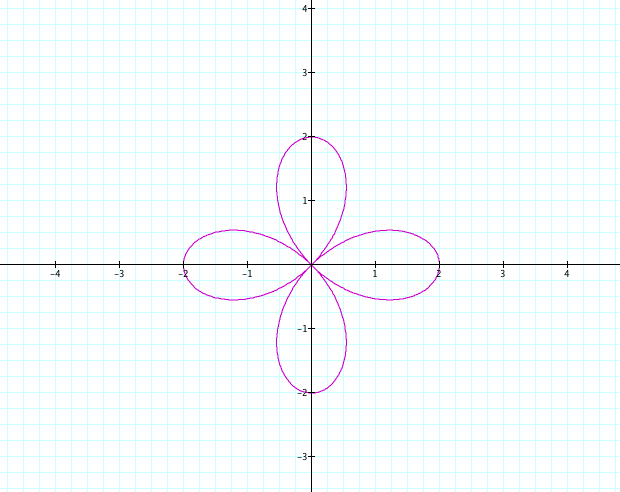
Let's investigate ![]() when a = b = k = 1.
when a = b = k = 1.
When you vary k from -5 to 5.
When k = 0, then it's a circle centered at (0, 0) with radius = 1.
When |k| < 1, it's a line spiraling out at (1, 0).
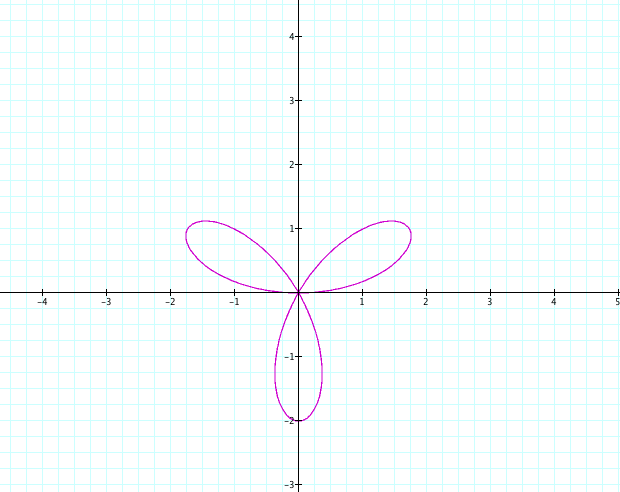
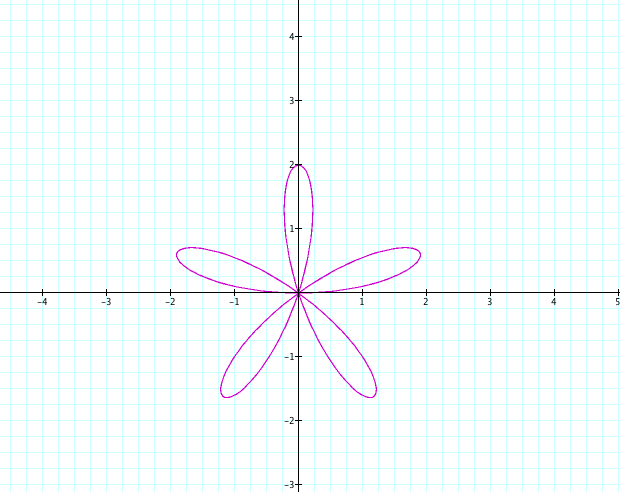
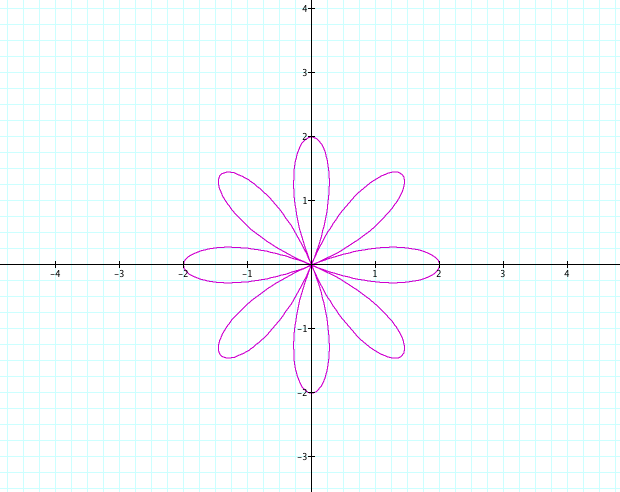
When |k| = 2, it forms 4 "flower petals" 2 small and 2 big. As k gets bigger, "flower petals" keep adding to the graph.
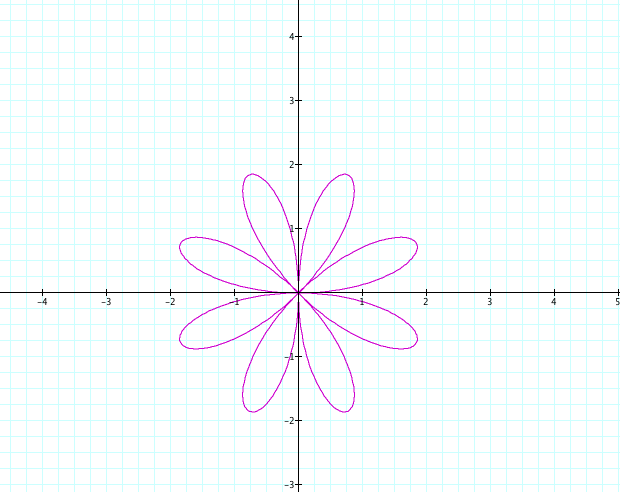
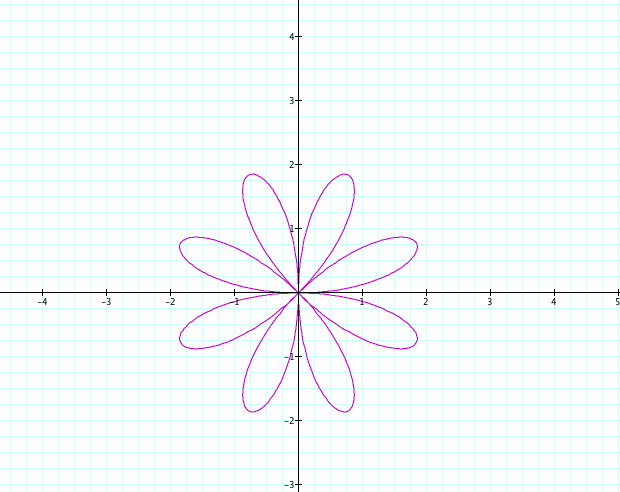
So when |k| = 5, there are total of 10 flower petals; 5 big and 5 small ones inside each big petal.
When you vary b from -5 to 10.
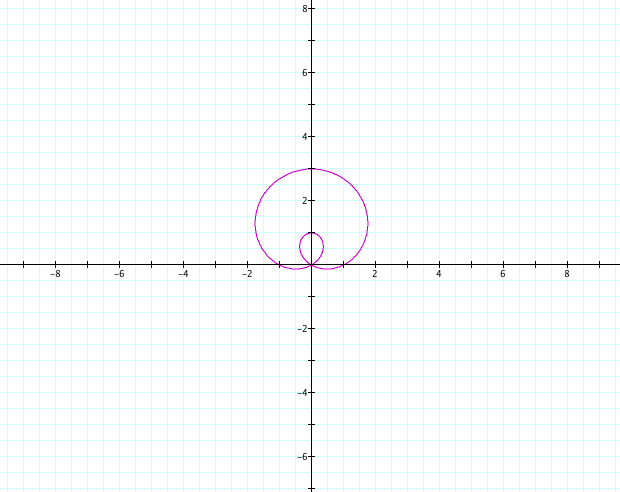
As b moves from |2| to |5|, the graph looks like a circle with a dent in the bottom. As b gets bigger, the graph expands so the dent starts to disappear. When |b| < 2, there exists a smaller loop inside a bigger loop. As |b| gets smaller, two loops start to come together so that when b = 0, it becomes a circle. |
When you vary a from -5 to 10.
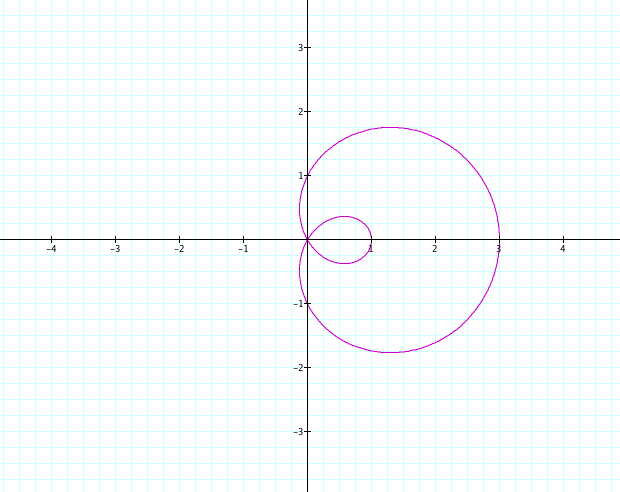
When a < 0. then the graph appears on the negative y-axis (III or IV quadrant). When a > 0, the graph appears on the positive y-axis (I or II quadrant). When a = 0, then it's a circle centered at the origin. When |a| < 0.5, the circle starts to cave in at the origin. As |a| > 0.5, you see another circle forming inside the bigger circle. Eventually, two circles (small one enclosed in a big one) keeps getting bigger as |a| gets bigger. |
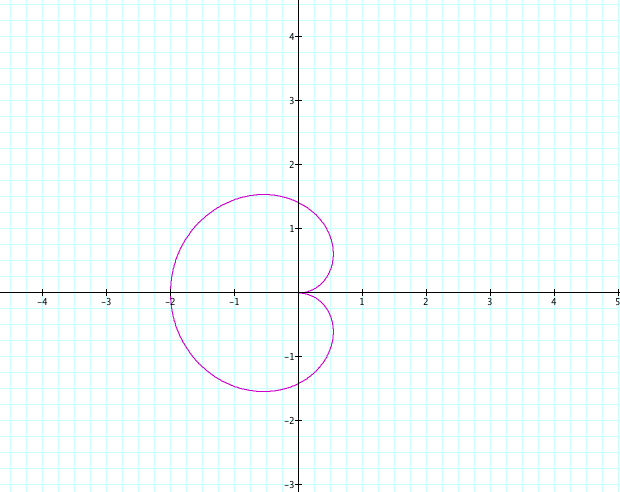
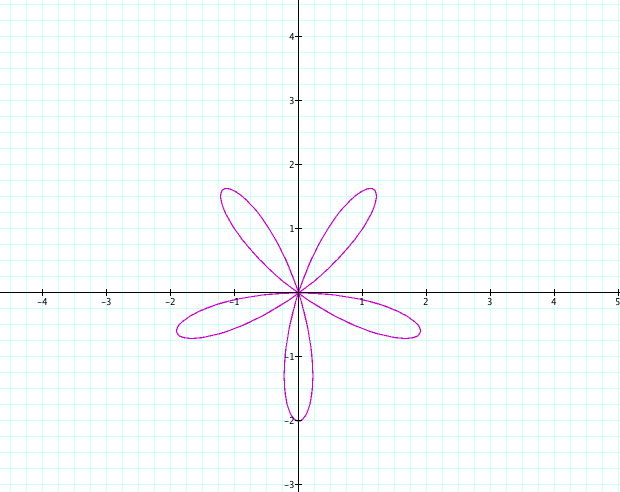
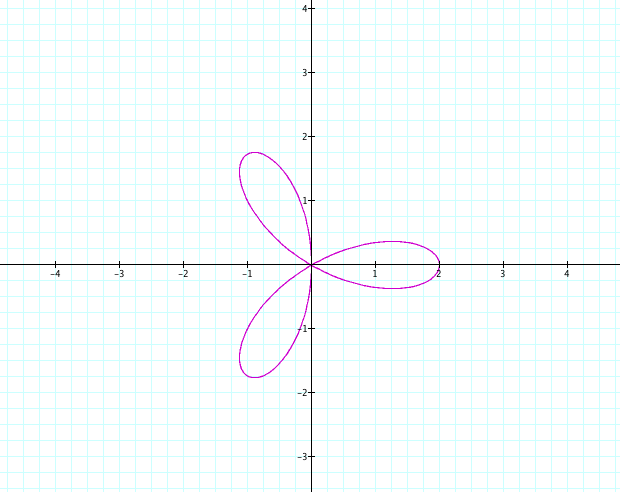
Let's investigate ![]() when a = b = k = 1.
when a = b = k = 1.
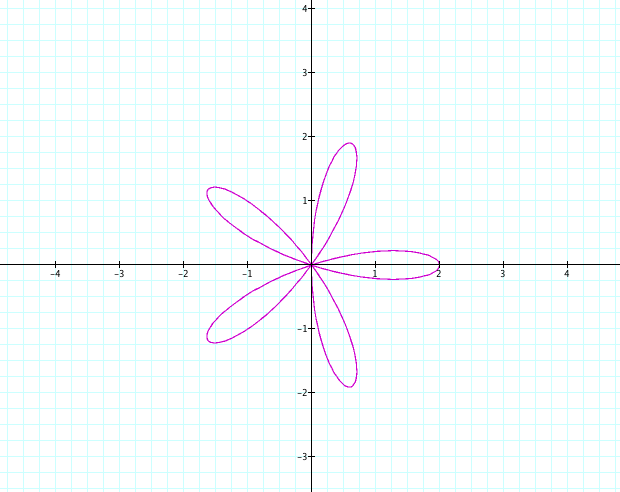
It appears to be same shape as ![]() but it's been rotated 90 degrees.
but it's been rotated 90 degrees.
Let's see what happens when we vary the variables. First, let's vary k and see how different degrees will affect the graph.
The graph looks very similar to but it looks like it's been rotated. Otherwise, it shows similar behavior as |
Let's vary a from -5 to 5.
Once again, it shows similar behaviors of a graph
Unlike the above equation, when |a| < 0, it stays on the negative x-axis instead of negative y-axis (II or III quadrant). When |a| > 0, it stays on the positive x-axis (I or IV quadrant).
|
Let's vary b from -5 to 5.
Once again, it shows similar behaviors of but the graph has been rotated. |
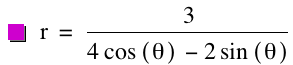
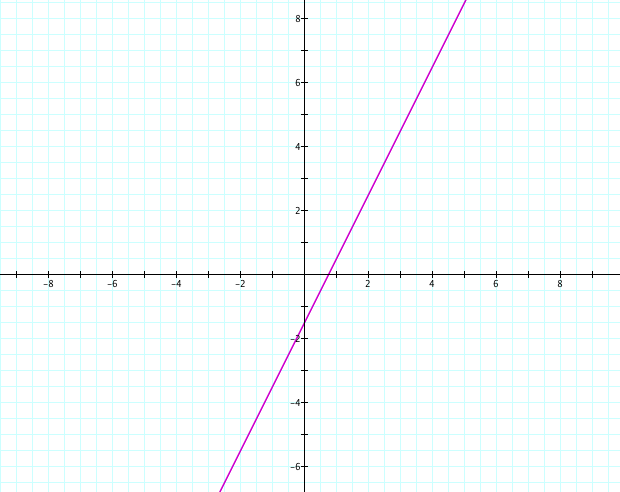
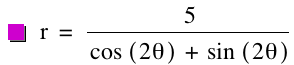
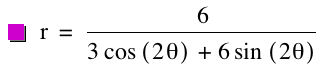
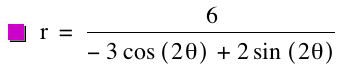
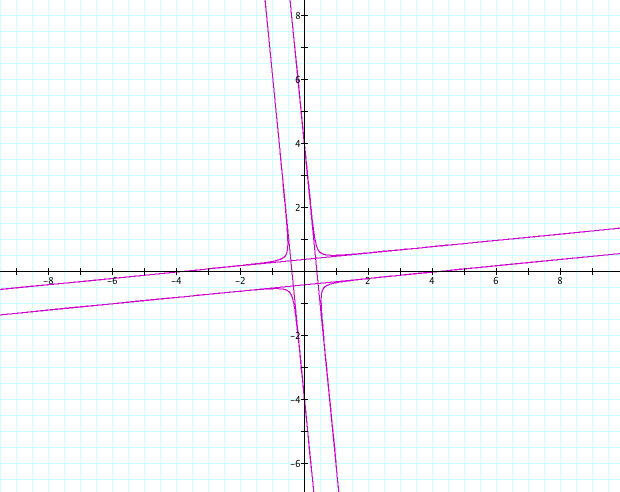
Now, let's investigate
where a = b = c = k = 1
It appears to be a straight line.
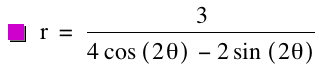
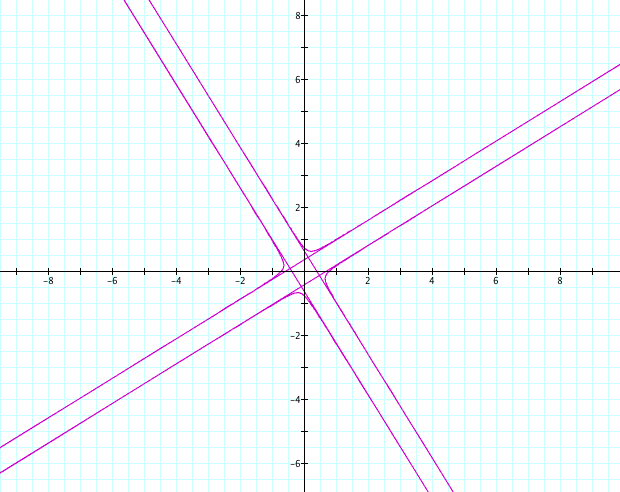
as k varies from -5 to 5.
It looks like fireworks!
When k = 0, it is a unit circle.
When |k = 0.4, that's when the spiral (or curve) meets with a tangent line.
I still had a hard time imagining what was going on, so I looked at |k| = 2.
It looks like the "flower petals" that appears with previous equations been "slit" open.
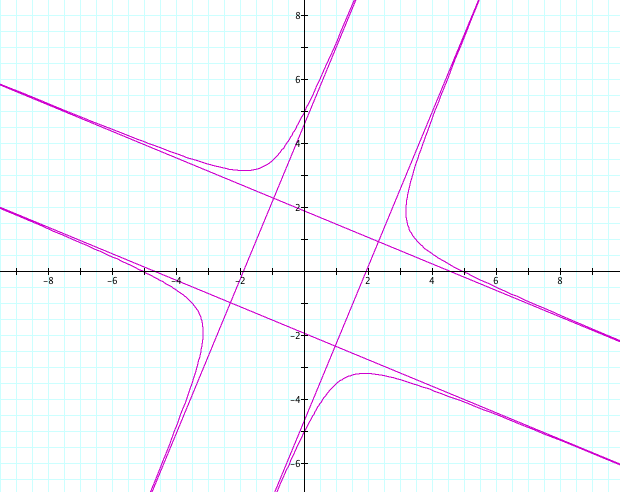
In the middle of the graph, there appears to be a quadrilateral with the lines extending
from each side. Using those lines, there are 4 hyperbola curves forming along those lines.
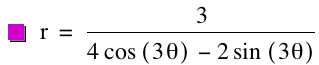
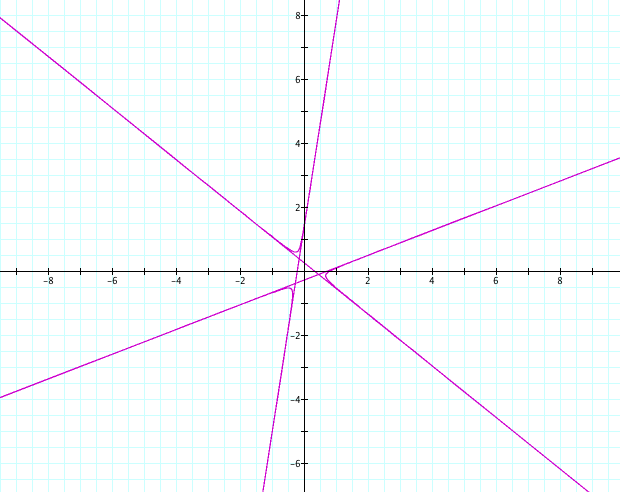
When |k| = 3, there appears to a triangle in the middle with the lines extending from each side.
Also, there are hyperbola curves forming along those lines.
When |k| = 4, there appears to an octagon in the middle with the lines extending from each side
and hyperbola curves forming along those lines.
When |k| = 5, there appears to be a pentagon in the middle with lines extending from each side and
hyperbola curves forming along those lines.
When |k| = 6, there appears to be a dodecagon in the middle with lines extending from each side and
hyperbola curves forming along those lines.
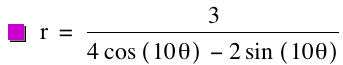
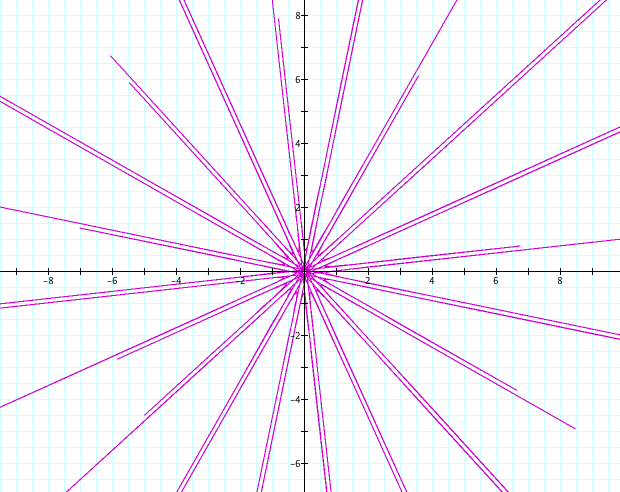
I expanded the numbers to -10 to 10.
I realized that when |k| is an even number, then polygon in the middle will be |k| * 2-gon.
When |k| is an odd number, then polygon in the middle will be |k| -gon.
as a varies from -5 to 5
It appears to be a straight line all the way.
When n < 0, the graph appears on I or III quadrant.
When n > 0, the graph appears on II or IV quadrant.
a acts like a slope in a linear function because as |a| gets bigger,
the line gets more slanted. As |a| gets closer to 0, the graph gets closer to the x-axis.
as b varies from -5 to 5
The graph shows similar characteristic as the above example.
However, as |b| gets bigger, the graph gets closer to the x-axis, opposite from above.
as c varies from -5 to 5
c affects the intercepts of the graph.
For example, when c = -5, the intercepts of the graph were
(-5,0) and (0, -5)
When c = 5, the intercepts of the graph were (5,0) and (0, 5).
When c= 0, the graph didn't exist.
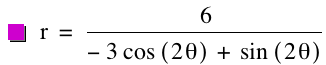
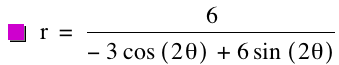
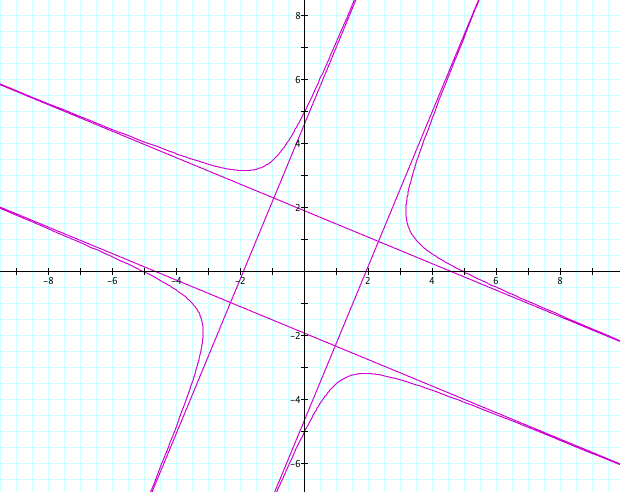
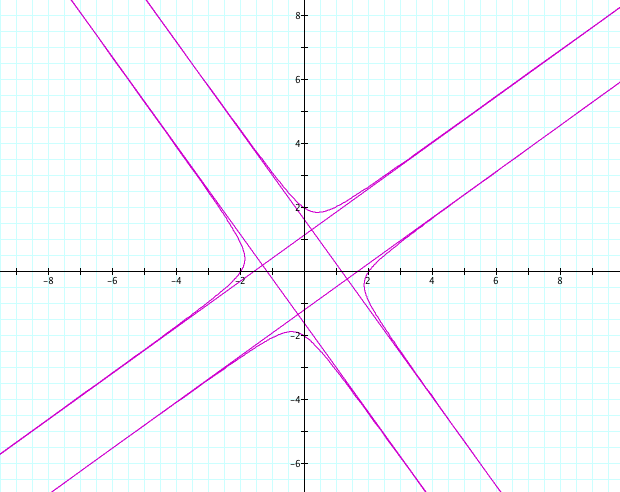
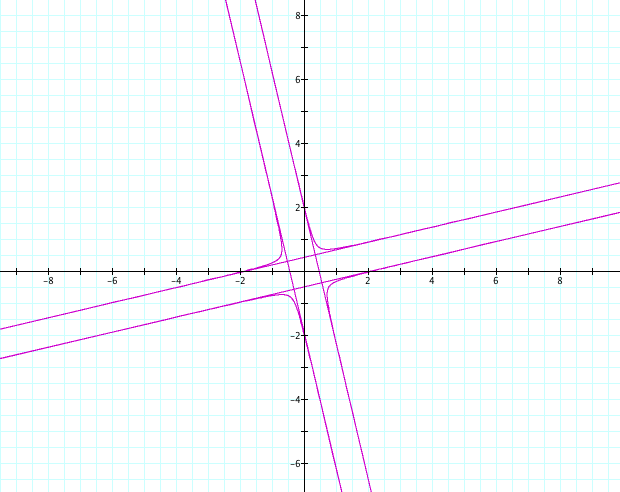
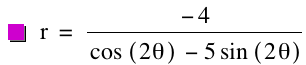
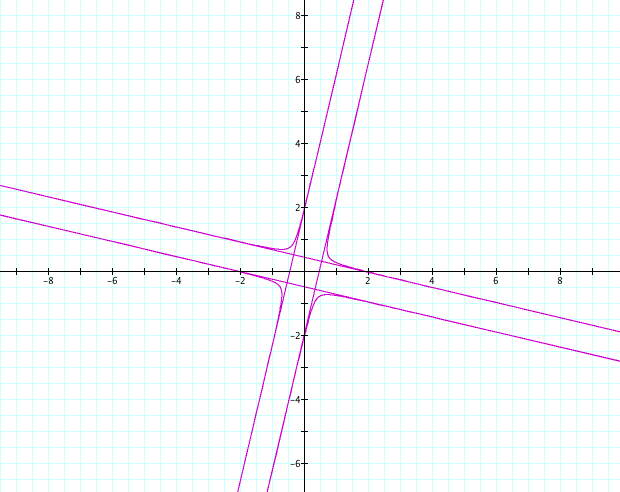
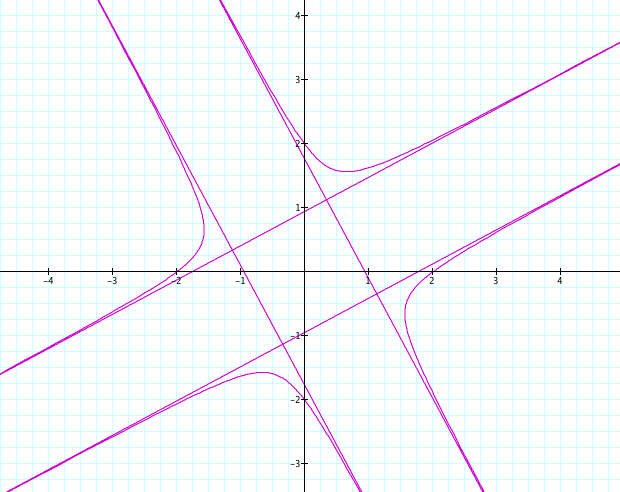
I wanted to investigate more about the effects of a, b, c, and k put all together.
It appears to be a line with x-intercept at (3/4) and y-intercept at (0, -3/2) Now, there is a quadrilateral inside. The hyperbolas intercept at (-3/4, 0), (3/4, 0), (0, 3/4) and (0, -3/4). The straight lines form a triangle. So far, I've observed that k affects how many lines that will intersect with each other to form a polygon in the middle. Since k is 2, the graph appears to be more like the second example from the first row. The hyperbola intercepts at (5, 0), (-5, 0), (0, 5) and (0, -5). It's the same graph as on the left. Therefore, the sign of c doesn't affect the graph. It changes the intercept but not the direction. Since k isn't change, the straight lines still form a quadrilateral. However, changing a, b, and c changed the intercepts and how the hyperbolas stretch. This time, only b is changed. The graph definitely "flattened" overall. However, the intercepts of the hyperbola didn't change while absolute values of the intercepts of the straight lines got smaller. Changing the sign of a didn't change the graph overall. Changing b so as it gets bigger, the absolute values of the intercepts of the lines get smaller as well.